Dead Cat Bounce Trading Strategy
The dead cat bounce trading strategy is designed to help traders accurately anticipate market movements and maximize their profits. Dive in to learn more!
To summarize the strategy:
|
What is A Dead Cat Bounce Trading Strategy?
The Dead Cat Bounce Trading Strategy is an investment technique that traders use to try to profit from the market continuing downward after a short-term price rebound. The strategy is based on the assumption that after such a sharp market decline, the market will only make a temporary recovery before resuming its downward trajectory. So, traders open short positions to benefit from the continuation of the falling trend.
Traders must be careful not to confuse this temporary bounce for an actual reversal trend and open long positions as this could lead to significant losses if the price resumes its bearish trajectory.
Personally I call it " Fake Reversal "
To help distinguish between a real market reversal and a dead cat bounce, traders often employ technical indicators such as Moving Averages, MACD, and Parabolic SAR.
Also, This strategy implies that the price of an asset will often ‘bounce’ off of major resistance structures before continuing to fall, giving the investor an opportunity to make a profit before it continues its downward path.
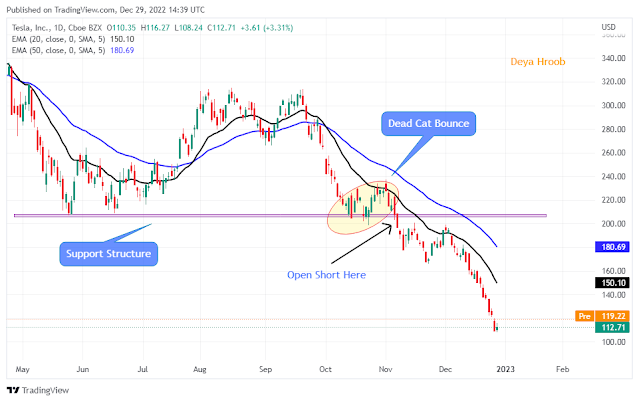
A recent example of a dead cat bounce can be seen in the price action of Tesla (TSLA) stock on the daily chart. After a bearish move, the stock briefly rebounded from the $198.40 level, but failed to make a convincing reversal to the upside as the moving averages still did not signal a clear uptrend.
How to trade Dead Cat Bounce?
To trade the dead cat bounce, you will need to identify a bearish trend in a trading pair. Look for a short-term correction where the price temporarily rises before falling again. This involves looking out for resistance levels such as Fibonacci Retracements or Moving Averages where the price of the currency could potentially reverse direction and create a "dead cat bounce" drop.
Once you have identified this, wait for the price to break through its previous low before opening your short position. Be sure to place your stop loss above the last high point to protect yourself against significant losses.
Examples of a Dead Cat Bounce Strategy
A recent example of a dead cat bounce can be seen in the price action of Tesla (TSLA) stock on the daily chart. After a bearish move, the stock briefly rebounded from the $198.40 level, but failed to make a convincing reversal to the upside as the moving averages still did not signal a clear uptrend.
We got the confirmation of the strategy when price plunges below its last low at $198.00, which was also a strong support level -- indicating it's time to open a short position.
Let's take another example. This is USD/JPY daily chart. After a hard decline the pair stared to correct up. In spite of that, the moving averages and RSI didn't support a reversal in price, thus, we waited the price to break down the last low at 109.30 to go short.
How to Trade Aggressive Dead Cat Bounce Strategy ?
As the title suggests, this strategy for aggressive traders.
As a general rule , when the trend is strong bearish, we always look for sell signals. Thus, If you are looking to use the aggressive Dead Cat Bounce trading strategy, the first step is to identify a strong bearish trend. When prices rebound from support levels after a sharp decline, it’s time to watch for potential sell signals.
The best signal will be when the price reaches resistance levels and fails to break above it.
What differentiate this strategy from normal one above is that instead of waiting for the price to drop below the last low, you can short-sell the coin twice. The first one at the resistance structure and the second one when the price fall below the last low. This can be a great way to maximize your profits from the market and take advantage of bearish momentum.
Example of Aggressive Dead Cat Bounce Strategy
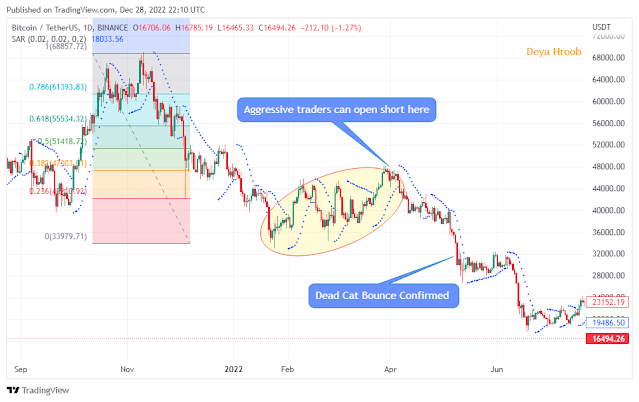
An example of a Dead Cat Bounce aggressive strategy could be seen in the daily chart of Bitcoin BTC/USDT. After a dramatic drop from its high near $69,000 to its low of $34,100, there was an attempted uptick back towards the $48,200 level before continuing downward again.
Let me show you how to trade this, I'll provide the same chart with some modifications.
When Bitcoin was experiencing a bearish trend, we were on the lookout for selling opportunities. This happened at the $48,200 level.
To illustrate, when the price of BTC bounced back from $34.100, we identified this as an excellent opportunity for a selling trade. This is because the price at $48,200 was at a Fibonnaci resistance level (0.382), it had failed to move beyond that level multiple times, and the overall trend was bearish. Therefore, we chose to initiate our first selling trade at the $48.200 mark.
Since then the price of Bitcoin kept falling, and broke below the last low at $34,100, confirming the Dead Cat Bounce and triggering our second sell trade. We just scaled into the trade by adding more shorts of Bitcoin.
You can learn more about Scaling in Trading Strategy here
Let's take another example :
This is a daily chart of EUR/USD. As you can see clearly, the overall trend is bearish, there is also a Death Cross spotted in the chart. Additionally, the price is trading below the major moving averages.
How to trade this? I will provide the same chart with some modifications.
Then, the pair met all our strategy conditions by falling below the last low at 1.1670, therefore we initiated the second short position.
Length of Dead Cat Bounces
Generally, dead cat bounces tend to be short and sharp in nature, due to their limited lifespan. This means that traders will typically have a limited time-frame in which to identify the possibility of a rebound and take advantage of it. The length of a dead cat bounce can vary depending on market conditions; however, most tend to last for around two weeks or less.
Strategies for Managing Risk While Trading the Dead Cat Bounce.
To manage risk while trading the Dead Cat Bounce , it’s important to make sure you enter and exit trades at appropriate times. Use stop-loss limits to minimize losses and set specific targets for when you want to take profits.
It’s also a good idea to use risk capital Percentage Position Sizing or Risk vs Reward Ratio calculations when entering each trade. This ensures that you size your positions based on realistic expectations and don’t over leveraging your capital in any one individual position.
.jpeg)


.gif)


Comments
Post a Comment