Ethereum Price Analysis: Charts Turn Bullish
By Deya Hroob
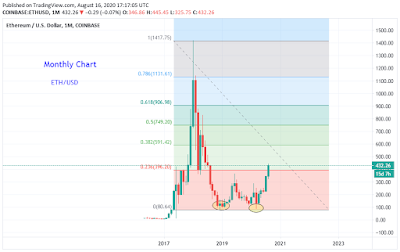
ETH/USD has formed a double bottom pattern. It's a bullish reversal pattern.
The next target for this chart is $590 while the support are $400 then $360. Ethereum remains positive as the price has held above the critical support at $360.
Monthly chart tells us that the main trend on Ethereum is now bullish.
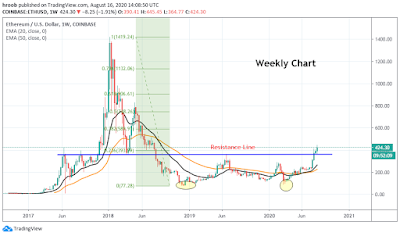
The price has penetrated an important resistance level $360. This is a positive sign.
The pair is trading now at $430. Bulls will target $590 levels now. It's the 0.382 Fibonacci Level. However, they may not achieve this straightforward. The price may retest the broken level at $360.
On the daily chart the price is currently trading above the main moving averages which indicates that the bulls have the upper hand.
Any dip will find support from the moving averages. Ethereum will turns negative if it drops below $290 level and our bullish view will be invalidated.
Monthly Chart
ETH/USD has formed a double bottom pattern. It's a bullish reversal pattern.
The next target for this chart is $590 while the support are $400 then $360. Ethereum remains positive as the price has held above the critical support at $360.
Monthly chart tells us that the main trend on Ethereum is now bullish.
Weekly Chart
The price has penetrated an important resistance level $360. This is a positive sign.
The pair is trading now at $430. Bulls will target $590 levels now. It's the 0.382 Fibonacci Level. However, they may not achieve this straightforward. The price may retest the broken level at $360.
Daily Chart
On the daily chart the price is currently trading above the main moving averages which indicates that the bulls have the upper hand.
Any dip will find support from the moving averages. Ethereum will turns negative if it drops below $290 level and our bullish view will be invalidated.


.gif)


.jpeg)


Comments
Post a Comment